Supply-demand imbalances, which occur when the quantity of a good supplied does not match the quantity demanded, intersect with multiple Sustainable Development Goals (SDGs). Such imbalances relate directly to SDG 12 (Responsible Consumption and Production), as balancing supply and demand is essential for achieving resource efficiency and reducing waste. They also impact SDG 2 (Zero Hunger) and SDG 3 (Good Health and Well-being), where imbalances in food and healthcare resources can lead to malnutrition and inadequate access to healthcare services, respectively. Moreover, supply-demand imbalances can exacerbate SDG 10 (Reduced Inequalities) as marginalized groups often bear the brunt of these disparities. Lastly, SDG 8 (Decent Work and Economic Growth) is also affected, as imbalances can cause market instability and impact employment rates.
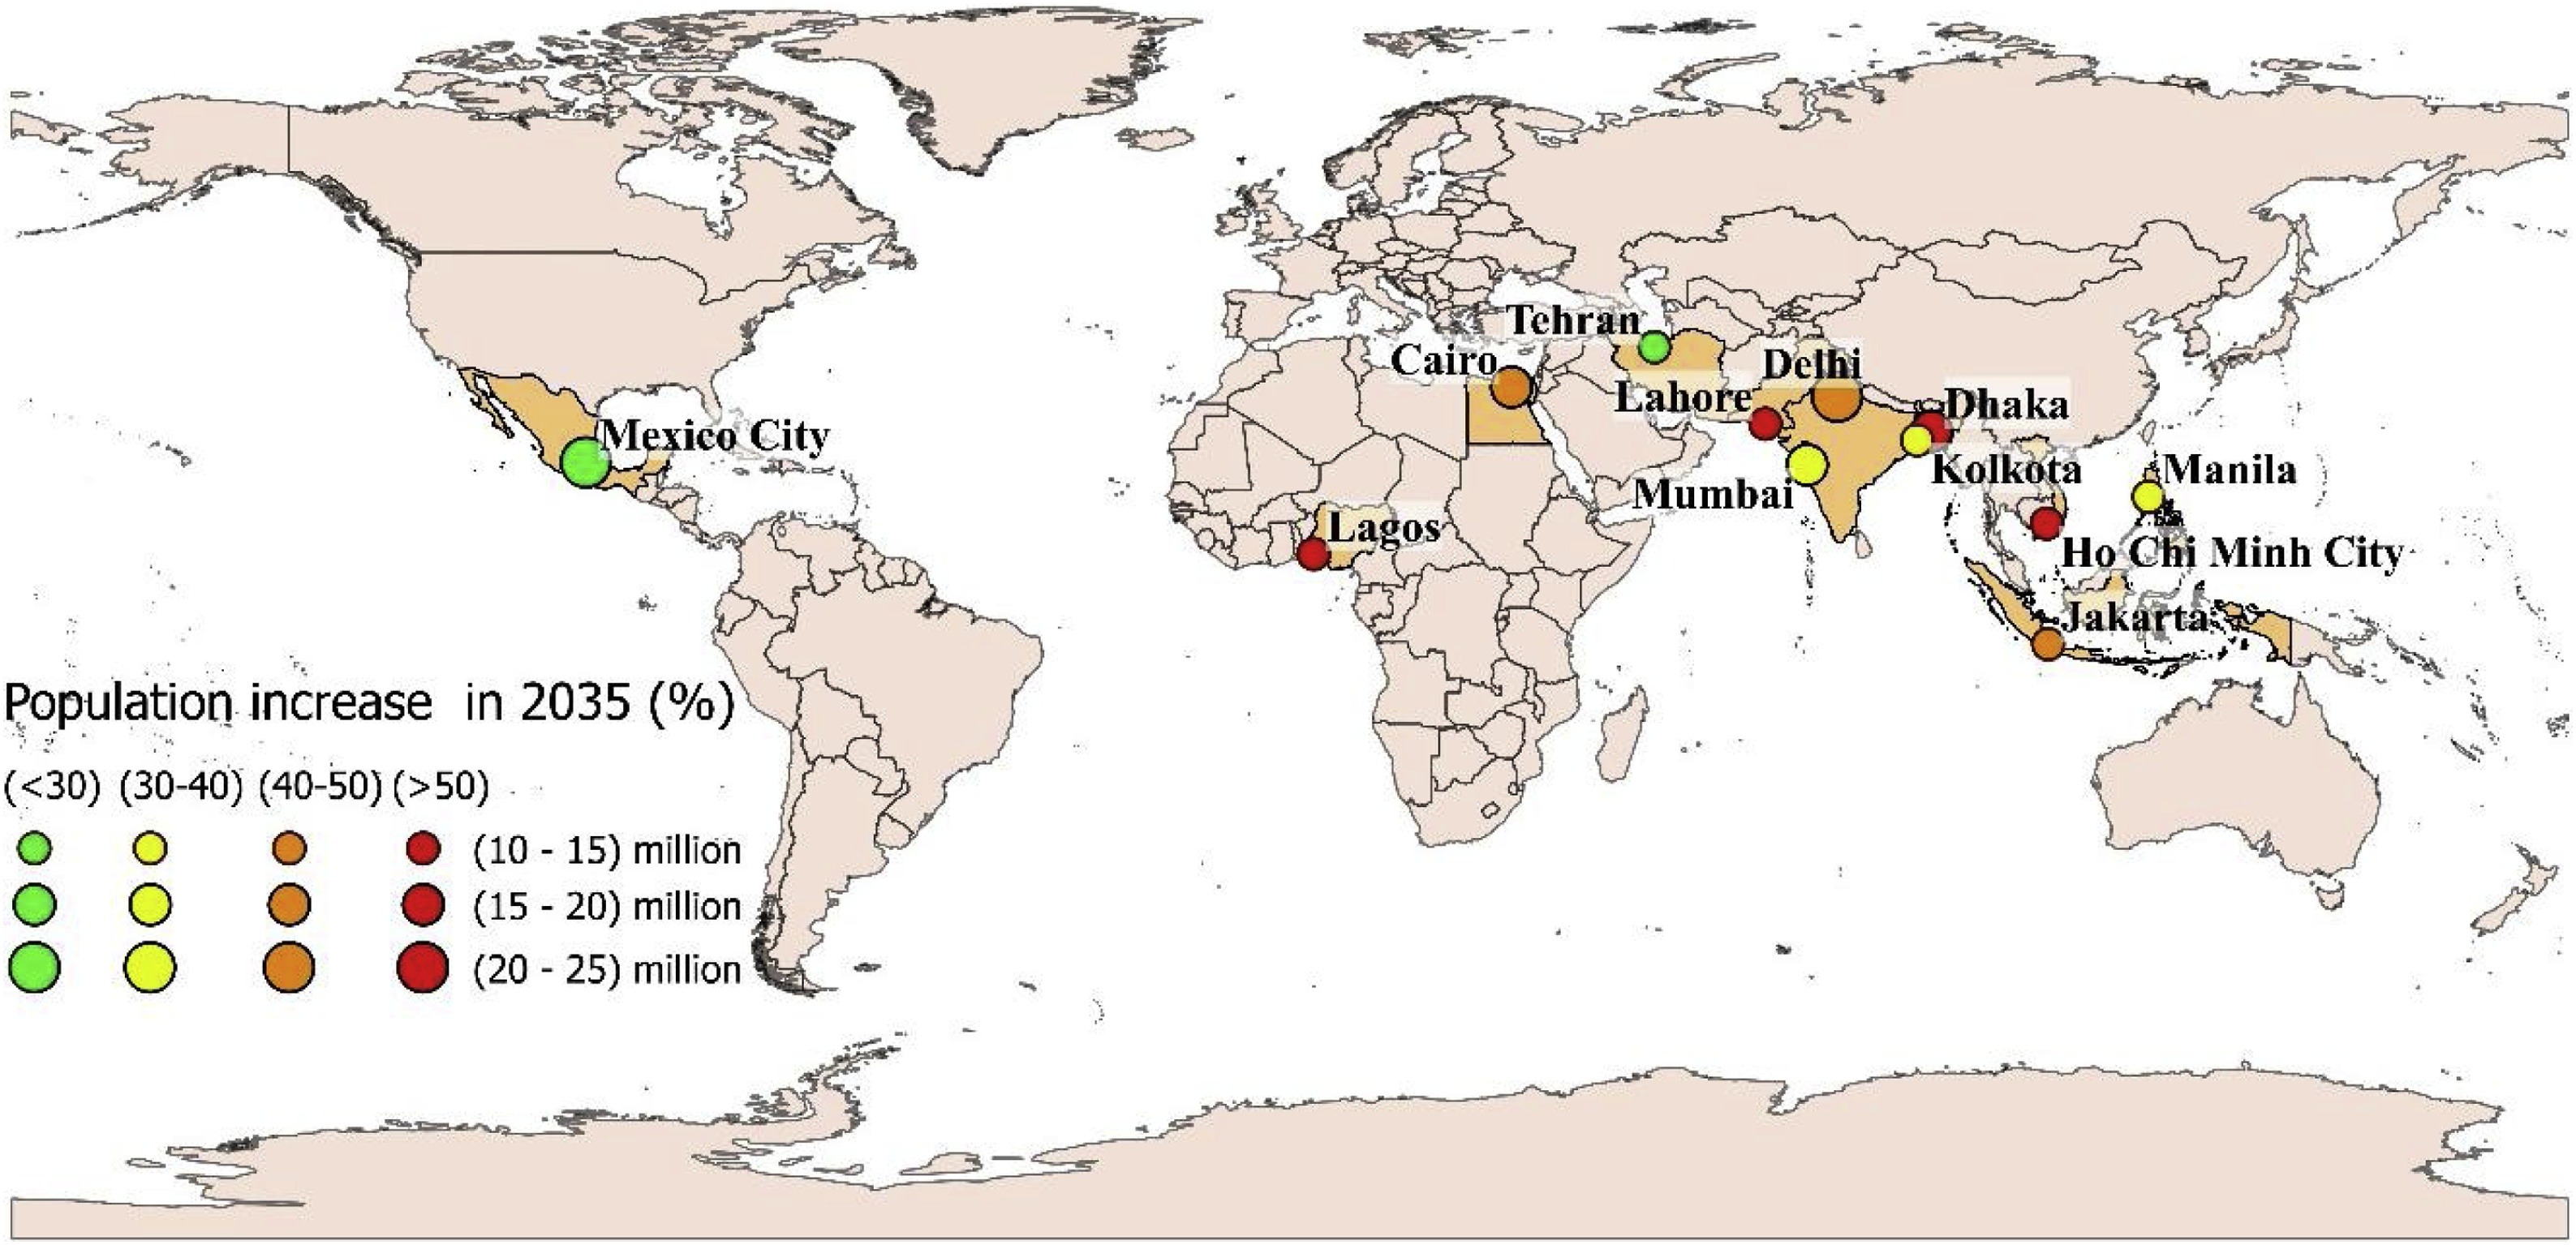
Urbanisation is increasing in many countries, leading to the establishment of 33 megacities, representing huge water demand which is increasingly difficult to supply, exemplified by the recently avoided Day Zero event in Cape Town (2018) and the ongoing water crisis in Chennai, India. The ongoing growth of megacities could lead to the potential for further Day Zero events in countries ill-equipped to deal with such a situation. This study analyses the water supply and demand situations in 12 megacities hosting 194 million people.
The increase in population coupled with rising per capita income and associated change in consumption habits will put unprecedented stress on food, energy and water (FEW) resources. Sustainable and reliable fresh water supply is central for life and also for all sectors that support our existence. Uncertainty on water security prompted interest in investigation of renewable energy driven desalination processes. One particularly promising option is to produce fresh water from the two most abundant resources on earth: solar energy and seawater.
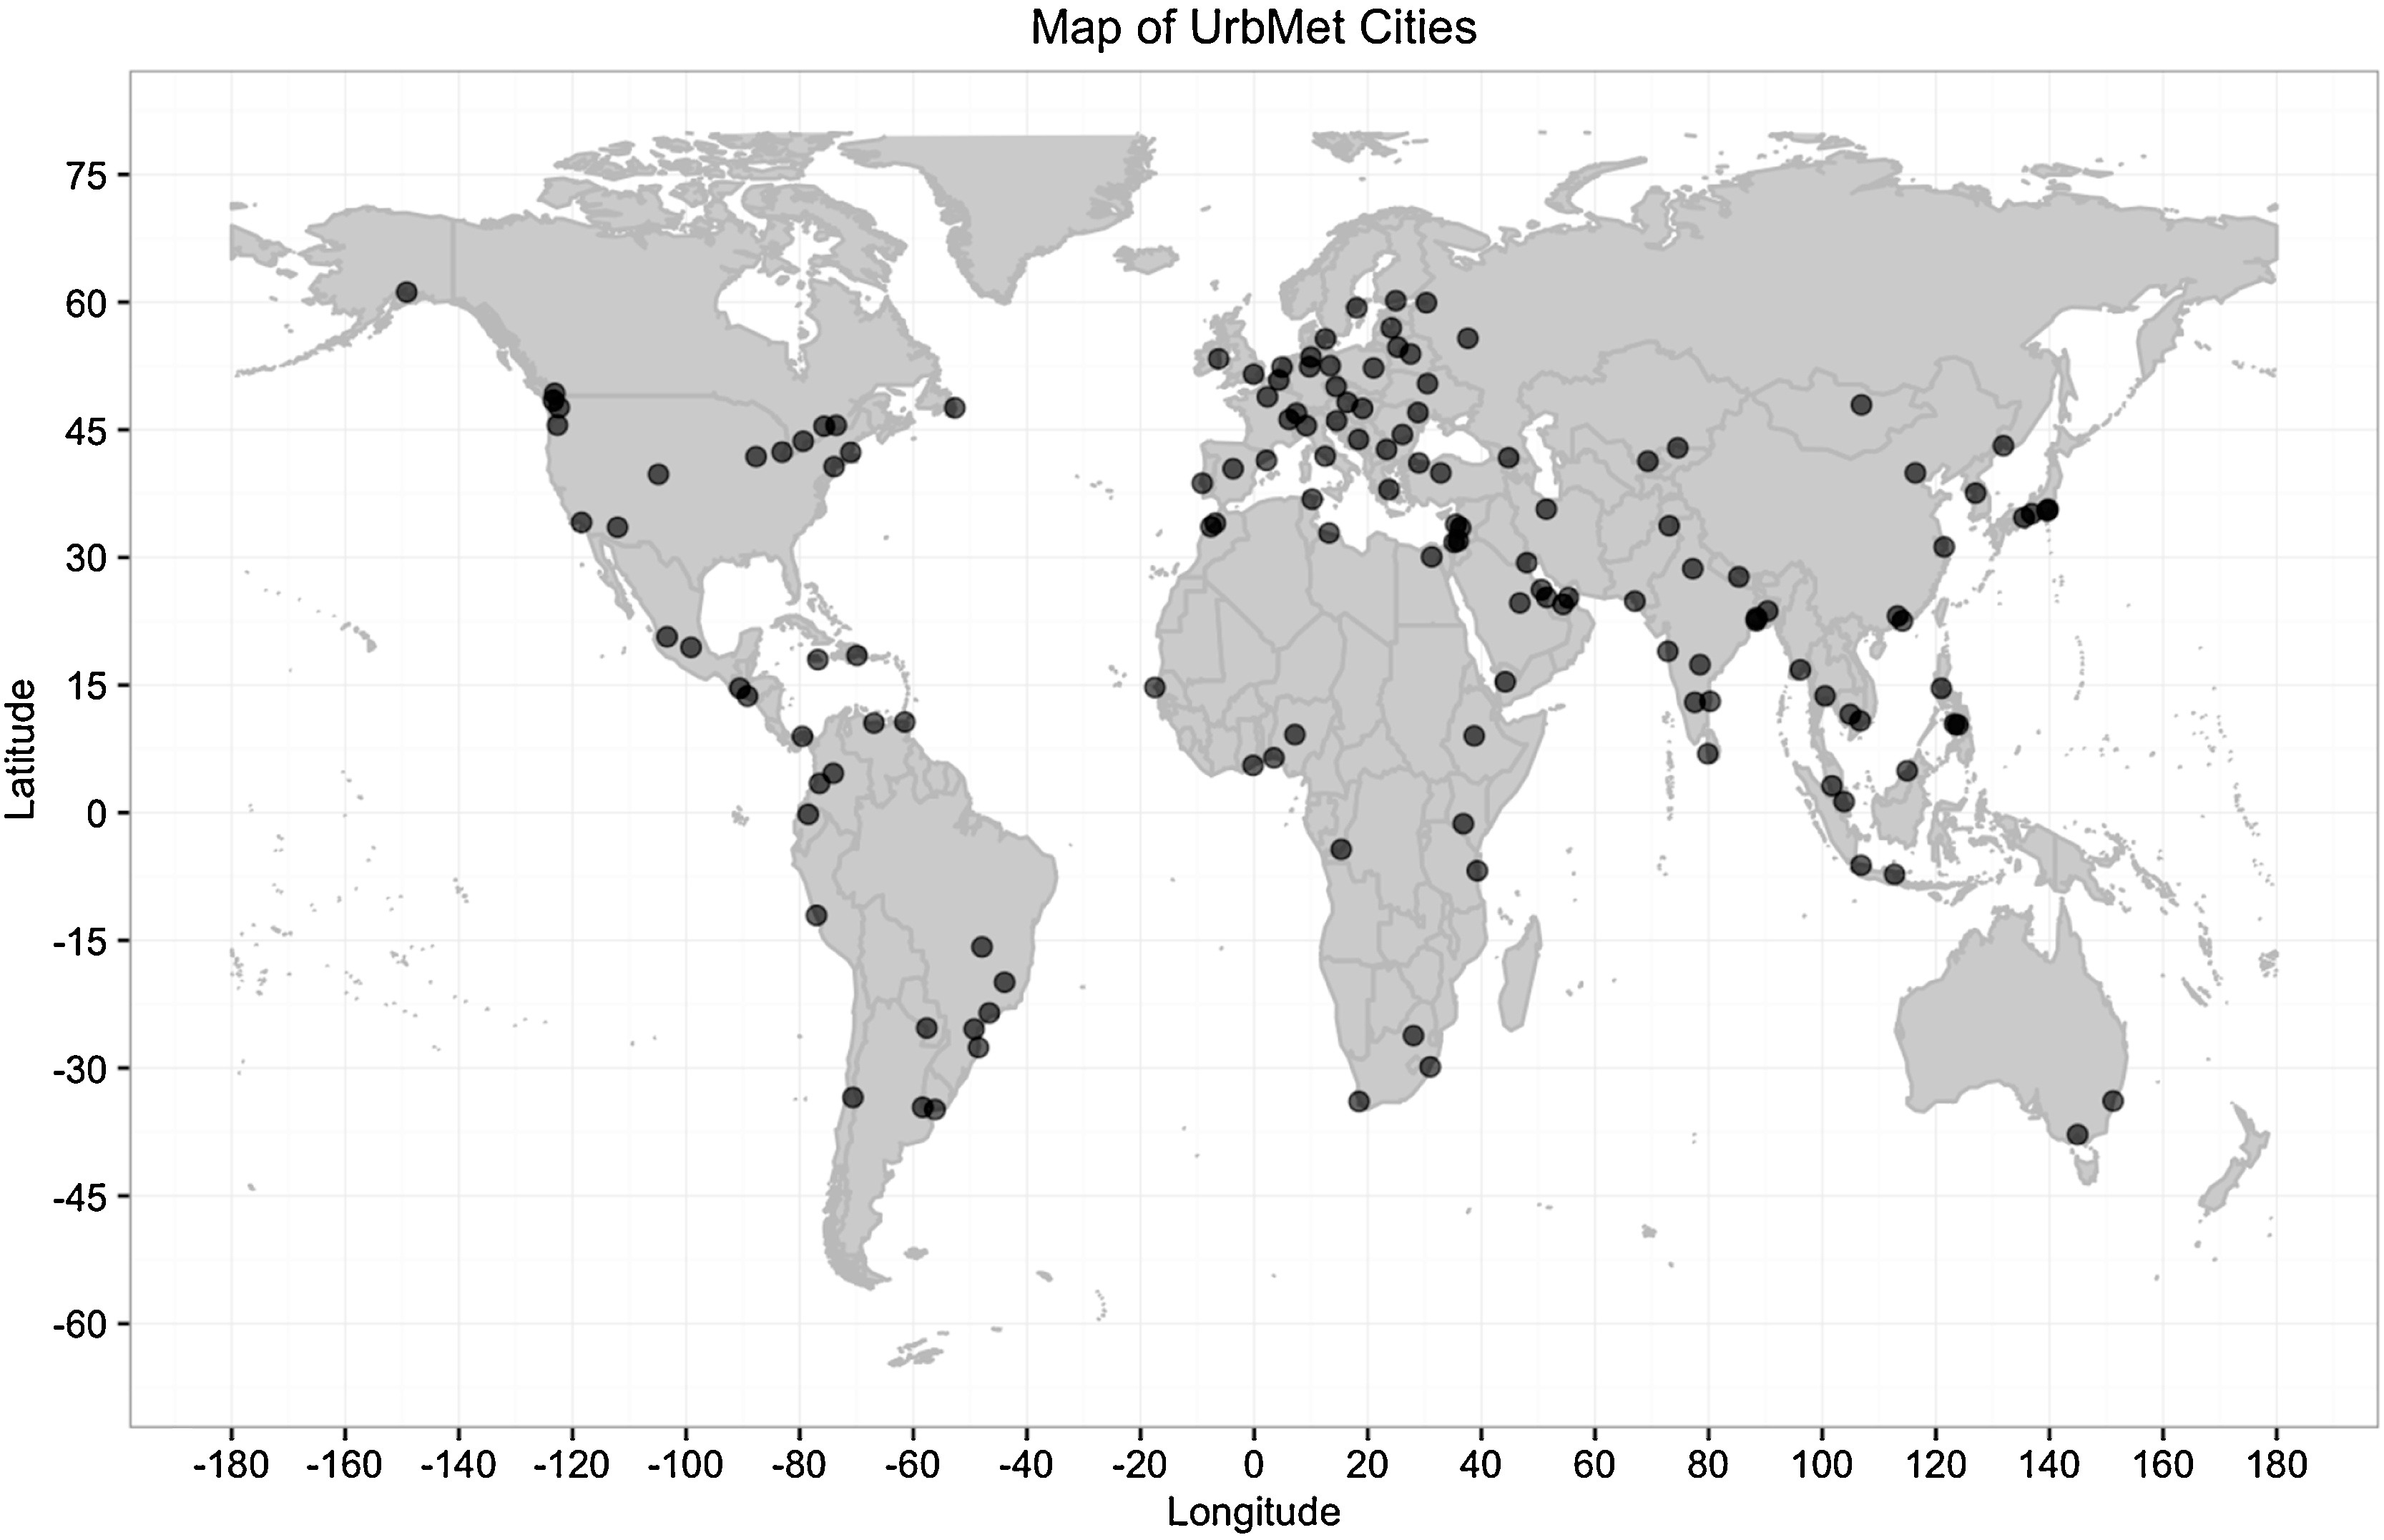
The sustainability of urban water systems is often compared in small numbers of cases selected as much for their familiarity as for their similarities and differences. Few studies examine large urban datasets to conduct comparisons that identify unexpected similarities and differences among urban water systems and problems. This research analyzed a dataset of 142 cities that includes annual per capita water use (m3/yr/cap) and population. It added a 0.5 ° grid annual water budget value (P-PET/yr) as an index of hydroclimatic water supply.


